Recently, Philadelphia Inquirer soccer writer Jonathan Tannenwald shared the top 10 local markets for English-language viewership of U.S. Men’s & Women’s National Team games in 2024.
The 10 markets, eight of which are included in the largest television markets in the country per Nielsen, include several markets in the Northeast and Mid-Atlantic, with additional markets in the Central, Mountain, and Western regions of the country.
In total, the markets account for over 35 million TV households in America, averaging more than 3.5 million households each. Here’s each market’s TV households, including Seattle-Tacoma (#13) and Denver (#17)—the two not included in Nielsen’s top 10 designated market areas (DMAs).
- New York: 7,595,250
- Los Angeles: 5,905,230
- Washington, DC (Hagerstown, MD): 2,577,690
- Chicago: 3,648,640
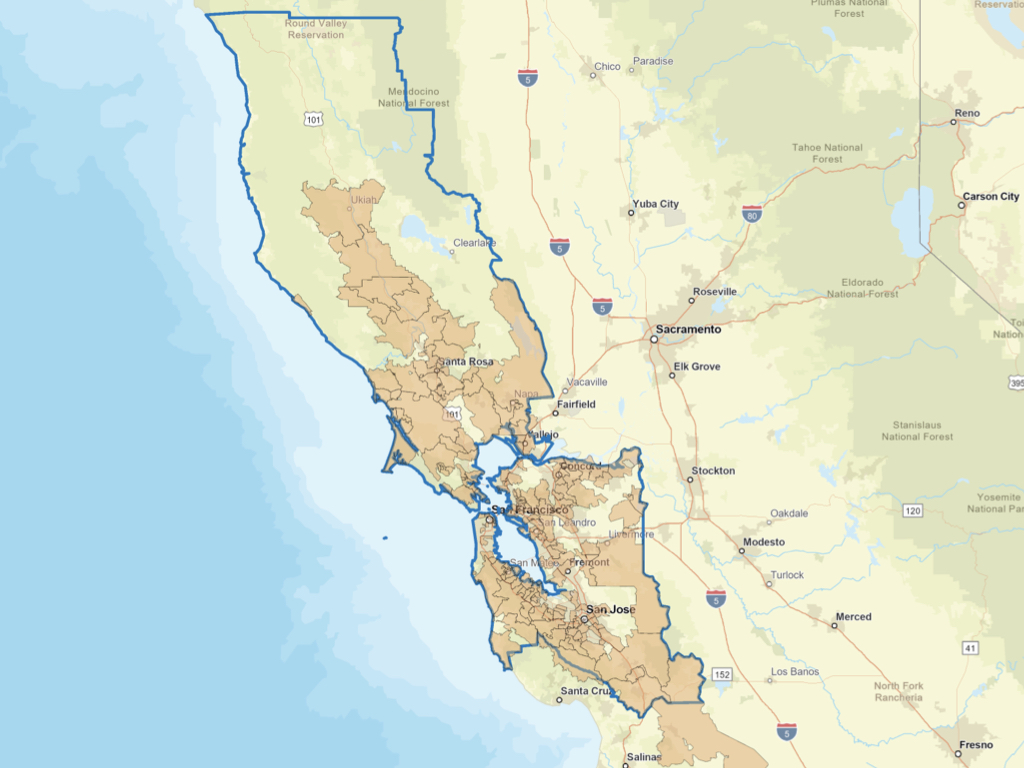
- San Francisco-Oakland-San Jose: 2,520,350
- Boston (Manchester, NH): 2,606,030
- Philadelphia: 3,176,540
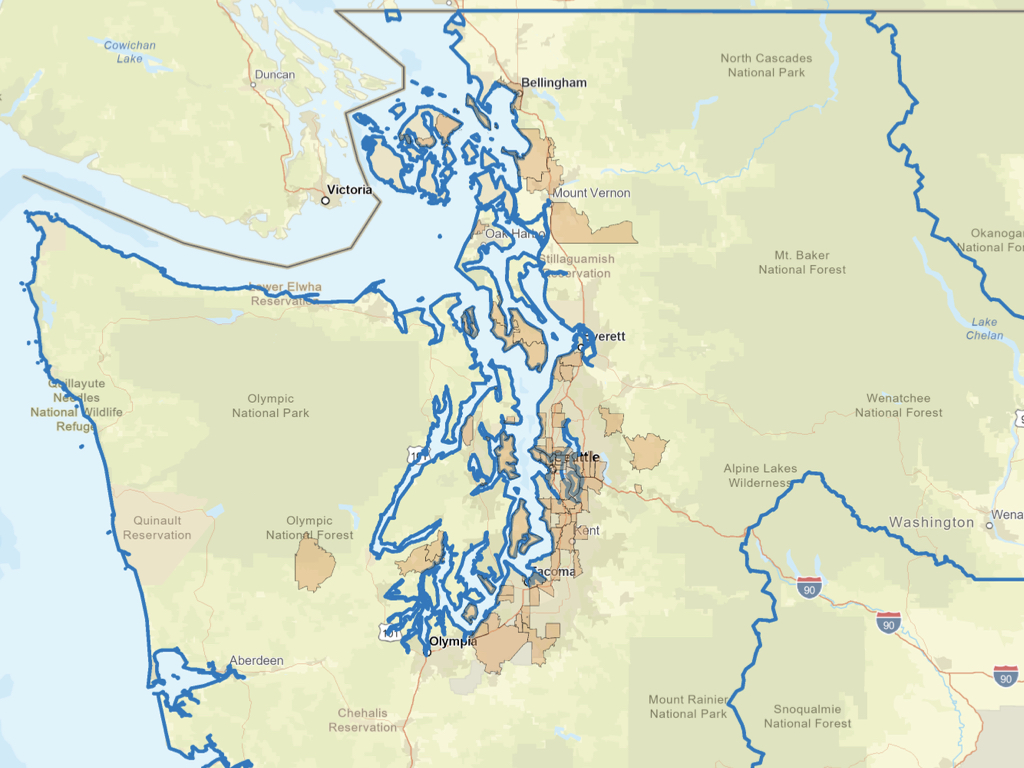
- Seattle-Tacoma: 2,070,920
- Denver: 1,787,410
- Dallas-Fort Worth: 3,130,430
Where do U.S. Soccer fans live in each DMA?
We know the top markets, but let’s go one step deeper. DMAs often cover a lot of distance—Denver, for example, covers more than 8,000 square miles. So, what areas within each DMA are most likely accounting for the strong U.S. Men’s and Women’s National Team viewership?
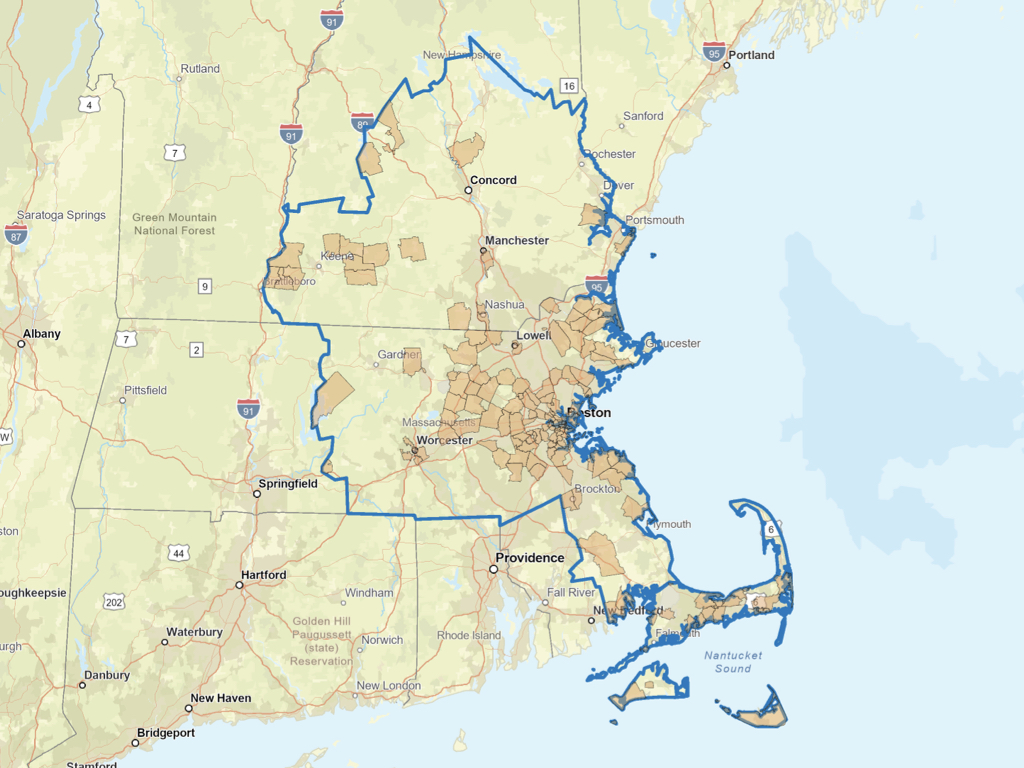
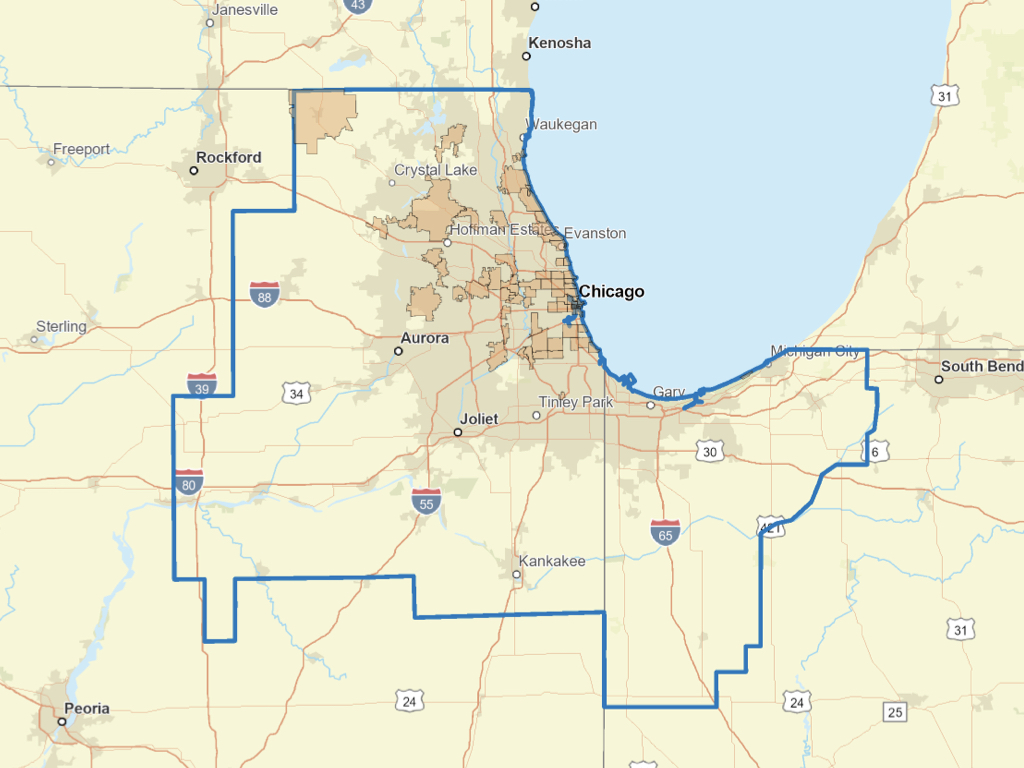
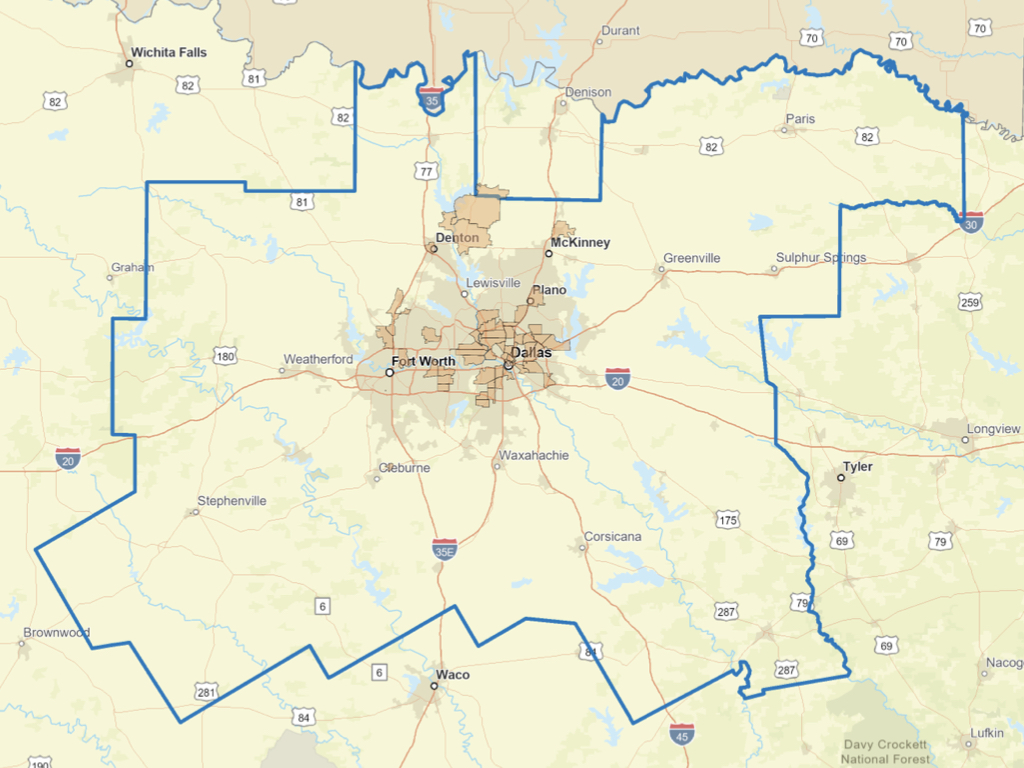
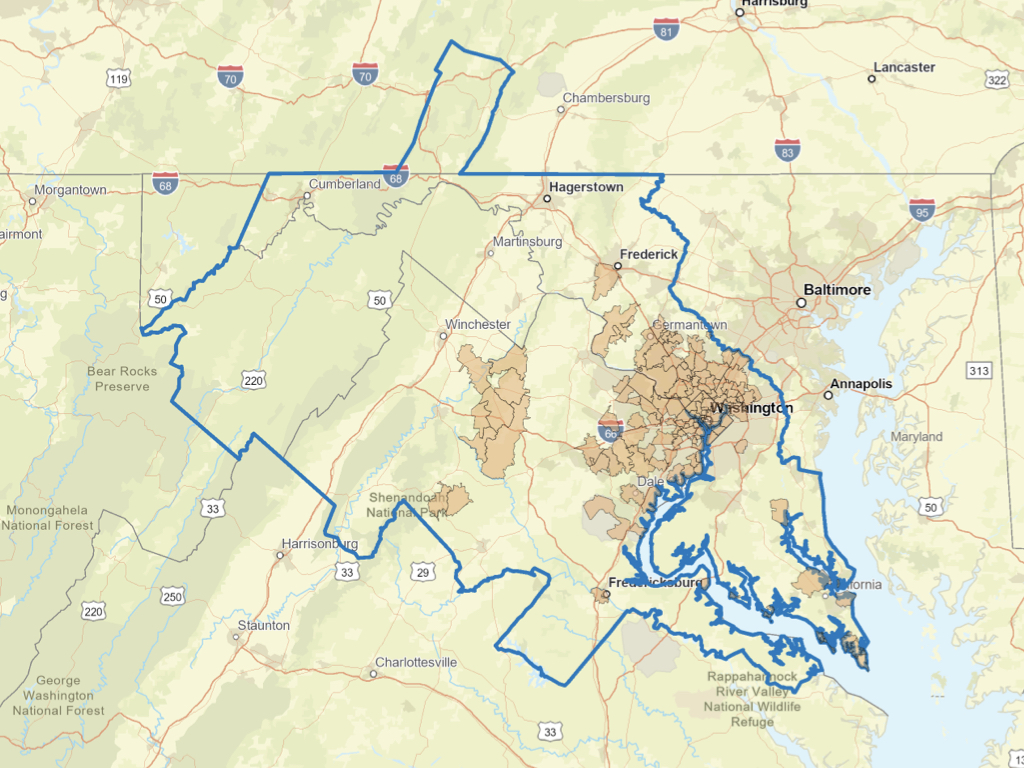
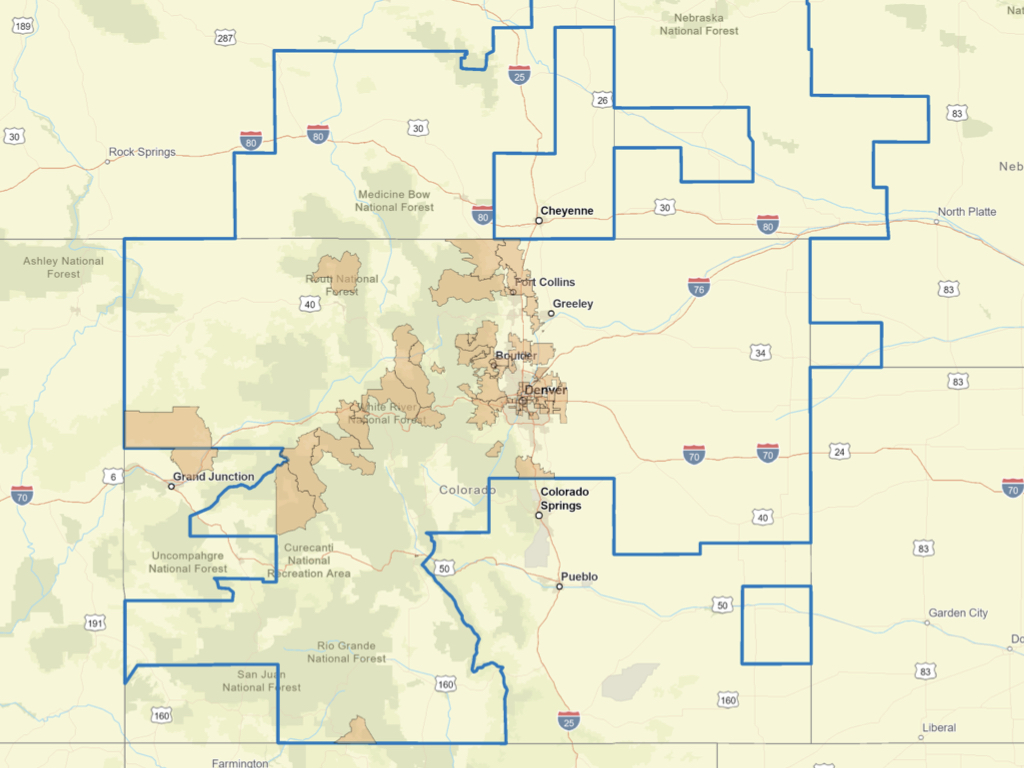
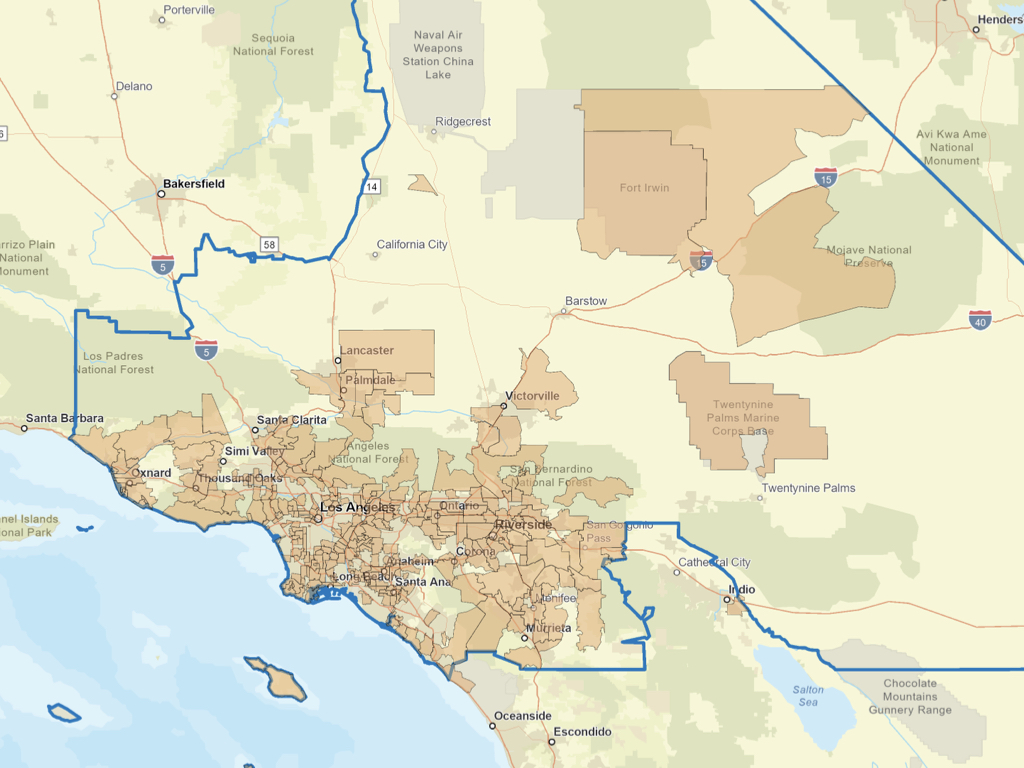
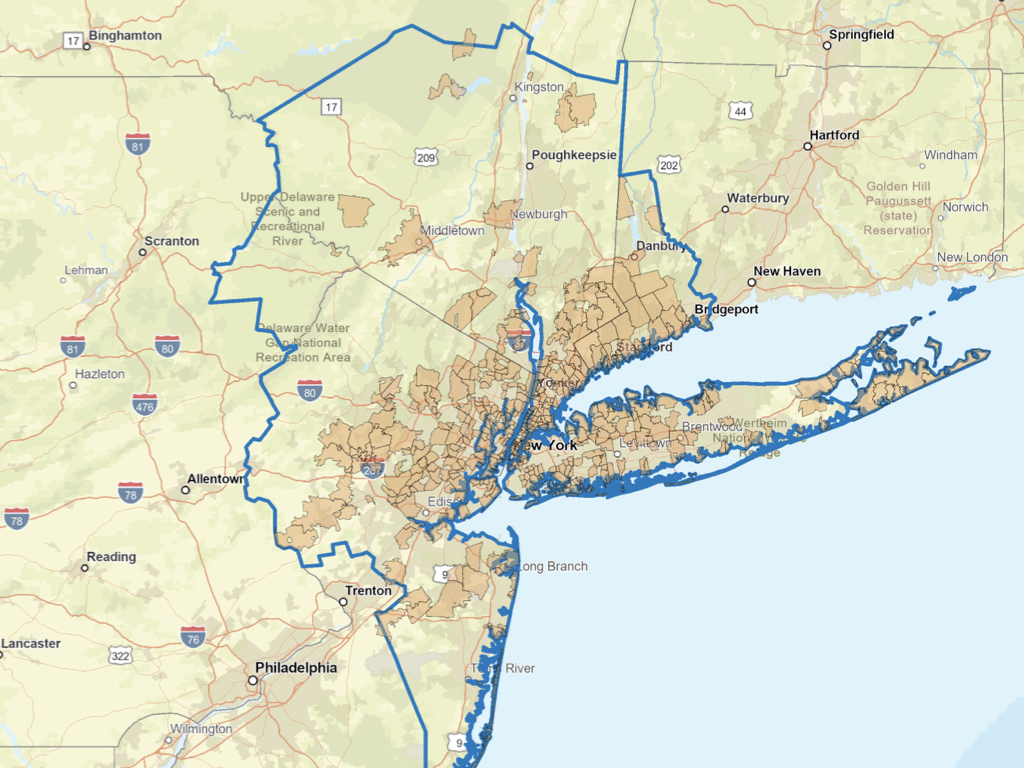
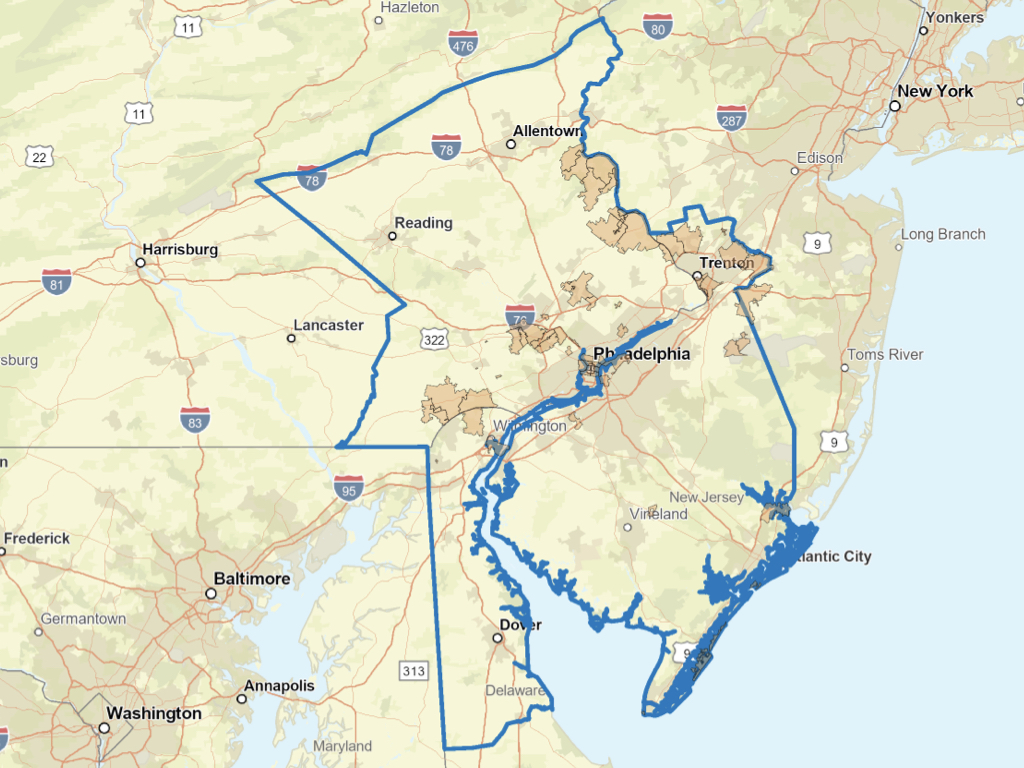
Using data from the U.S. Census Bureau and MRI-Simmons, below are zip codes (highlighted in orange) within each of the ten DMAs where viewership of both USMNT and UWSNT games among residents is at least 10% higher than the national average.
Across all 10 DMAs, more than 1,600 zip codes meet this criteria, accounting for nearly a third (31%) of all 5,200+ zip codes. Below is additional detail for each DMA, including the number of zip codes matching criteria within each and the percentage of the total.
| Market | Zip Codes Fit Criteria | % of DMA Zip Codes |
|---|---|---|
| Boston, MA (Manchester, NH) | 171 | 33.30% |
| Chicago, IL | 76 | 17.20% |
| Dallas-Ft. Worth, TX | 56 | 13.00% |
| Denver, CO | 86 | 18% |
| Los Angeles, CA | 294 | 50.50% |
| New York, NY | 459 | 41.40% |
| Philadelphia, PA | 71 | 13.40% |
| San Francisco-Oakland-San Jose, CA | 184 | 56.10% |
| Seattle-Tacoma, WA | 84 | 24.70% |
| Washington, DC (Hagerstown, MD) | 143 | 29.50% |
