We’re often asked about the current state of soccer in the U.S. and to answer that, we reference a combination of rising TV and streaming viewership, growing sponsorship revenues, an escalation of investments by American groups both at home and abroad, and the sport’s ever-expanding presence in the pop culture zeitgeist.
While each are undoubtedly important factors in soccer’s overall growth, we can’t ignore the most fundamental sign of growth—participation.
Historically, participation has been among the biggest gateways toward soccer fandom. Before there were My PL Mornings on NBC Sports, over 3,000 games broadcast on TV in a year, and over 75 professional clubs dotting all corners of the United States, there was kicking a ball on a field.
Additional insight: According to our 2023-24 United States of Soccer Report, 75% of all soccer fans have played soccer at some point in their lives and 42% are still actively playing.
To highlight the current state of participation in the U.S., we consulted the Sports & Fitness Industry Association’s (SFIA) most recent report on outdoor soccer participation. And here’s a quick headline: participation is up—not just year-over-year, but annually since at least 2018.
📈 Participation Shows Significant Growth
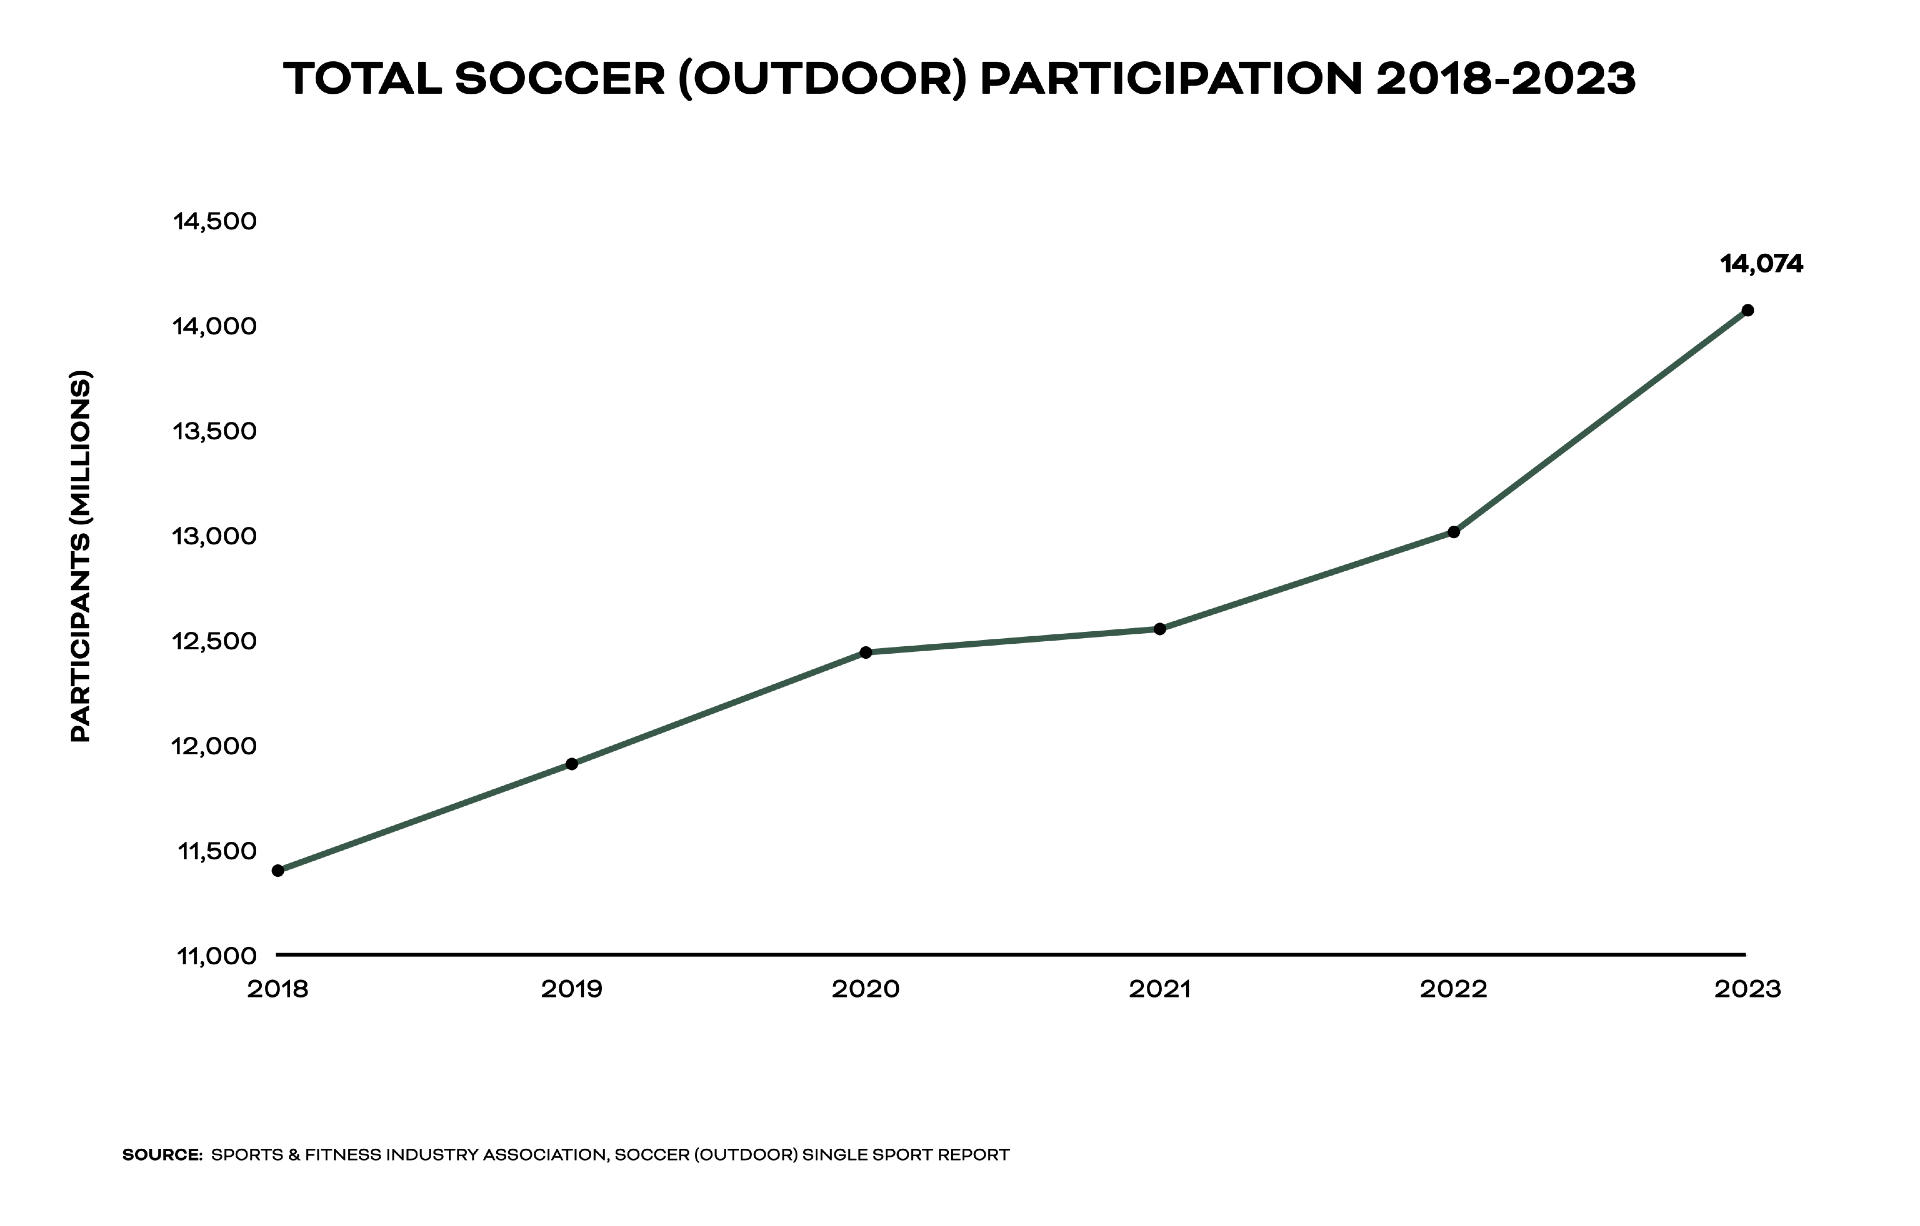
Through 2023, outdoor soccer participation among those ages 6 or older reached nearly 14.1 million players. This marks an impressive 8.1% increase from the previous year and a 23% increase compared to 2018. On average, the total number of participants has increased by 4% per year since 2018.

To take this insight one step deeper, the gender distribution of outdoor soccer participants is as follows: Male players account for 60% or roughly 8.4 million of the total, while Female players account for 40% or roughly 5.7 million.
💡 Core Participation Shows Dedicated Base
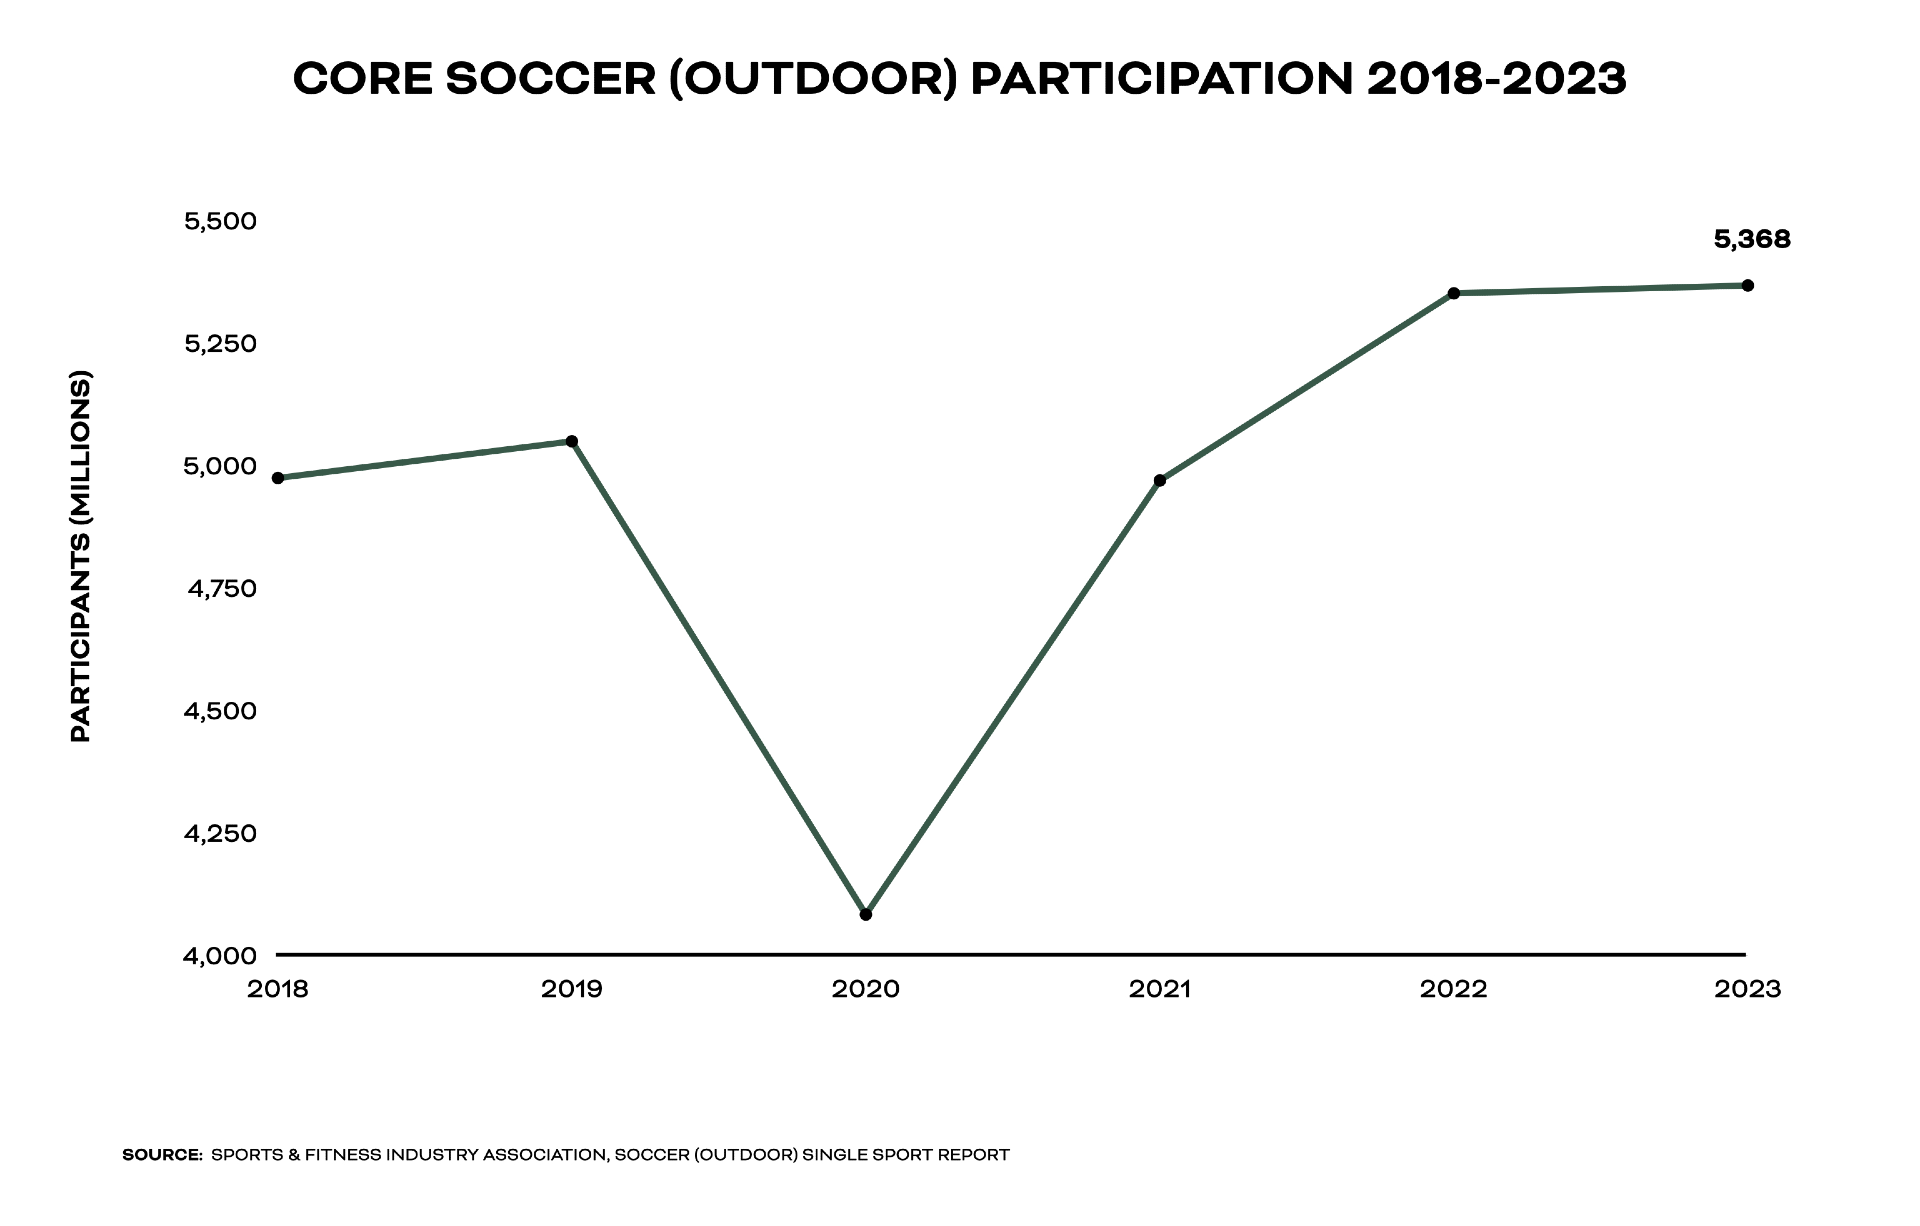
Not only is general participation up, but core participation—defined as those who participate 26 or more times per year—is also on the rise. Per SFIA, nearly 5.4 million players ages 6 or older fit this category and represent 38% of the total player base—casual players who participate 1-25 times annually comprise the remaining 62%.
Core participation is up 0.3% year-over-year and nearly 8% compared to 2018. On average, the total number of core participants has increased by 2.4% per year since 2018.

📊 Age Distribution Highlights Youth
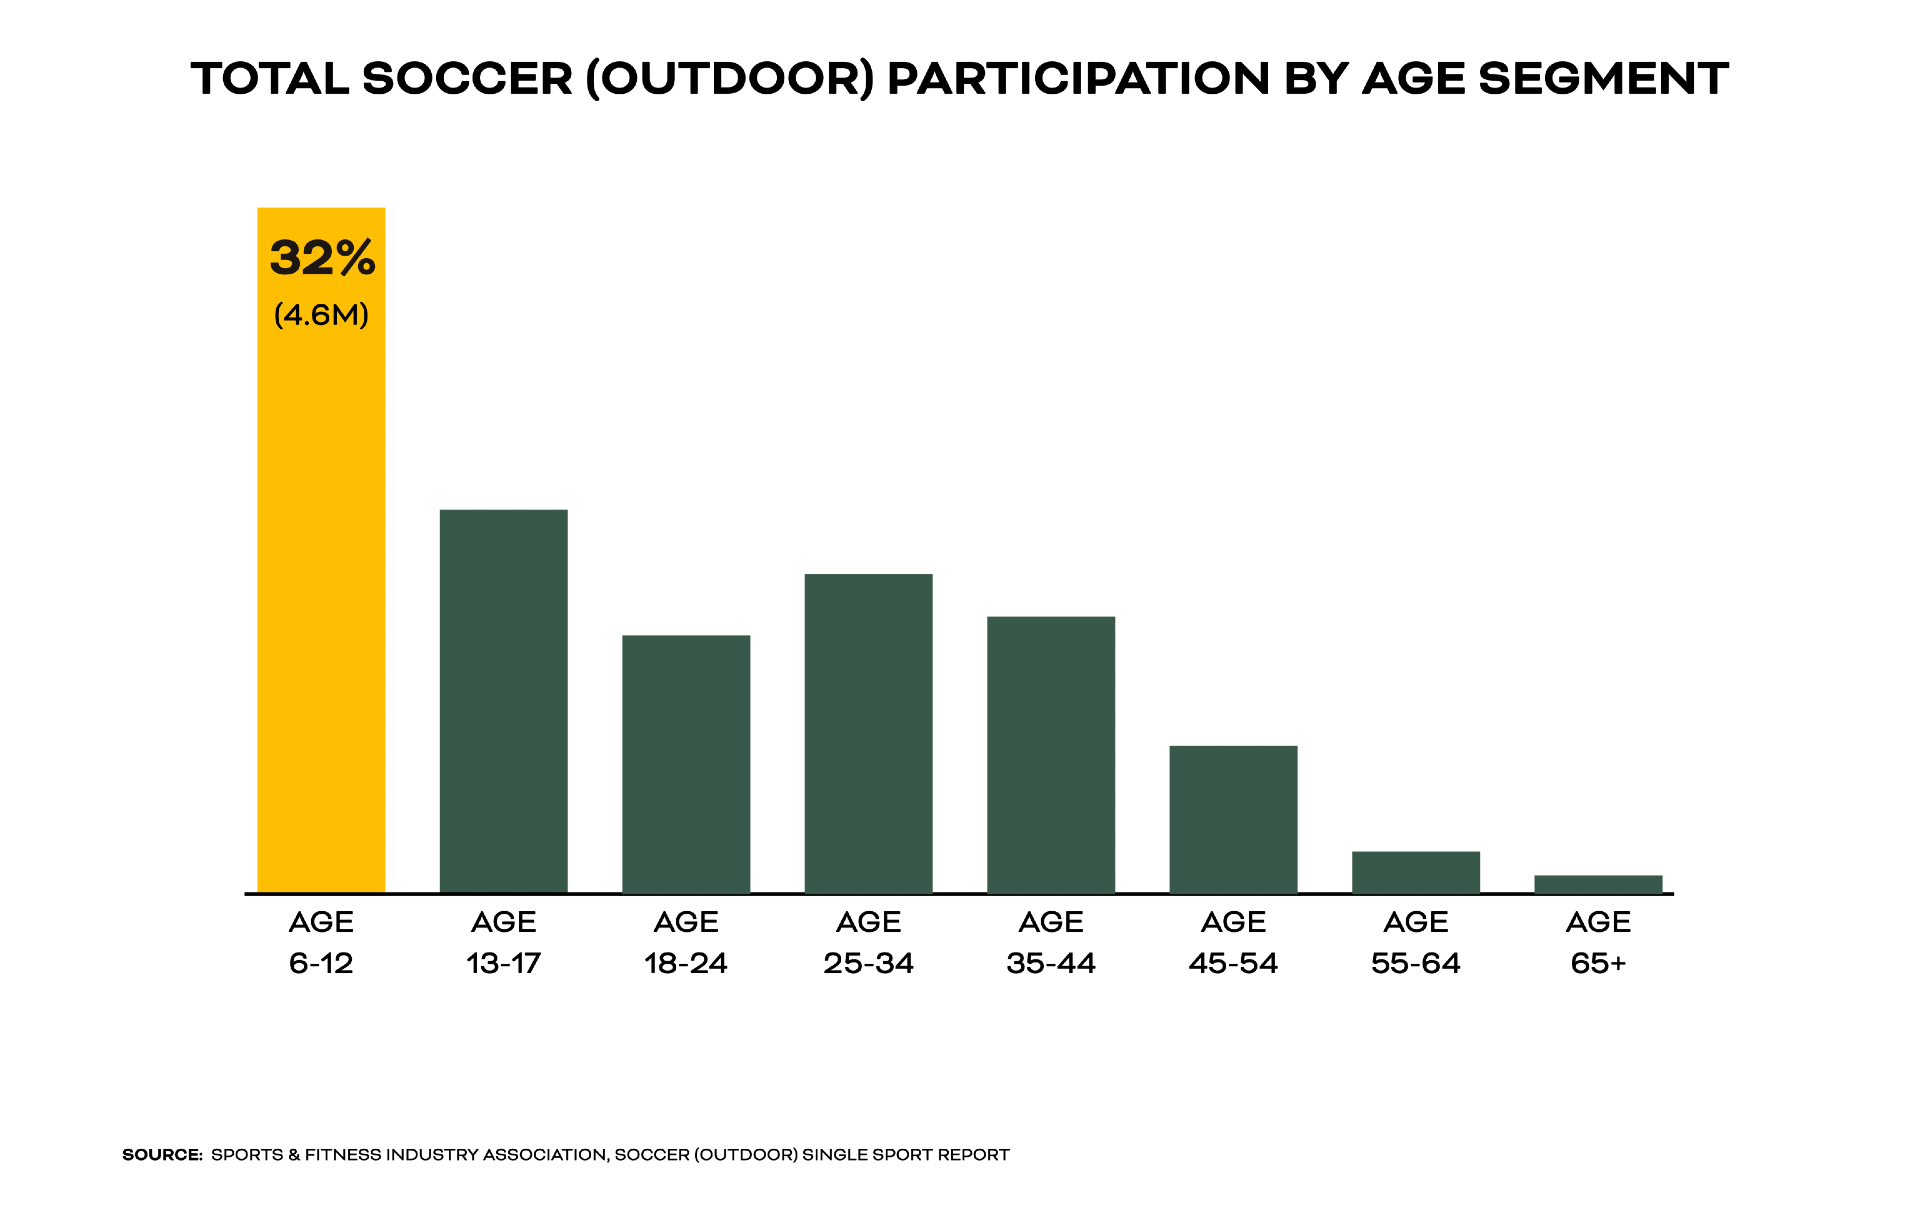
In terms of age distribution, the largest percentage of players ages 6 or older is those ages 6-12, who account for roughly a third of the total number of players. Add in those age segments under age 25 and you get just under two-thirds of all participants.

🔎 More Info on Soccer Participation
Want more detail? Check out the full SFIA report for additional insight into the ethnic and income distribution of players, the regional distribution of players based on the U.S. Census Bureau divisions, as well as the cross-sport participation interests of those who play soccer.
ADDITIONAL READING
Speaking of U.S. Census Bureau divisions and the regional distribution of soccer fandom in the U.S., we recently discussed how fan demographics and engagements differ around the country.